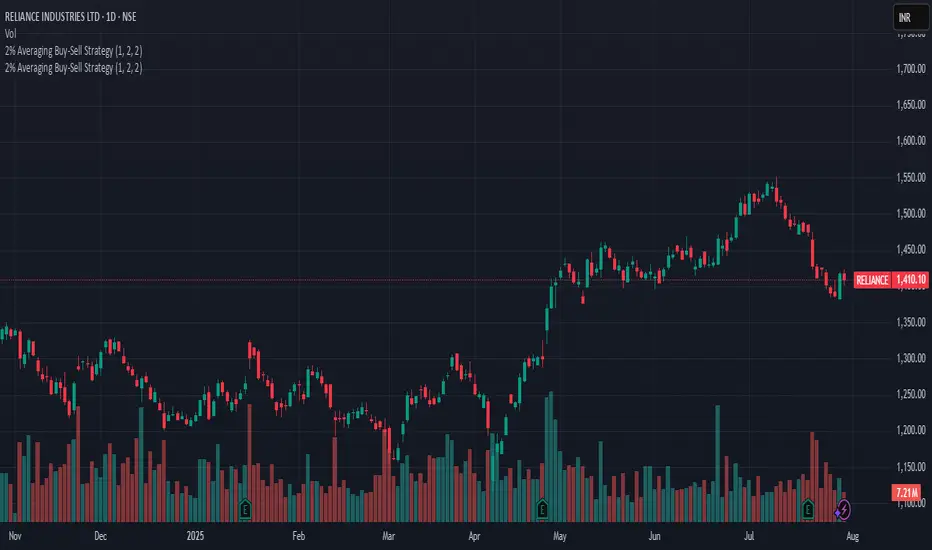
2% Averaging Buy-Sell Strategy📘 Strategy Description: 2% Averaging Buy-Sell Strategy
This strategy is designed to simulate an averaging-down and scaling-out approach based on percentage-based price movements.
Entry Logic (Buy):
Initial buy of 1 lot is triggered at the start of the strategy.
Every time the price drops by 2% from the last executed buy level, the strategy adds 2 more lots.
Exit Logic (Sell):
When the price rises 2% from the last buy level, the strategy sells 2 lots.
Selling continues in batches of 2 lots as long as the upward movement continues and lots are available.
Core Idea:
This is a dynamic averaging system that increases exposure during drawdowns and reduces it during rallies, aiming to capture mean reversion or trend reversals.
Customizable Inputs:
Initial lot size
Additional lot size
Percentage threshold (default 2%)
⚠️ Note: This strategy is for simulation/backtesting purposes. It does not account for slippage, fees, or real-world order execution conditions.
Cari dalam skrip untuk "Buy sell"
Net Buying/Selling Flows Toolkit [AlgoAlpha]🌟📊 Introducing the Net Buying/Selling Flows Toolkit by AlgoAlpha 📈🚀
🔍 Explore the intricate dynamics of market movements with the Net Buying/Selling Flows Toolkit designed for precision and effectiveness in visualizing money inflows and outflows and their impact on asset prices.
🔀 Multiple Display Modes : Choose from "Flow Comparison", "Net Flow", or "Sum of Flows" to view the data in the most relevant way for your analysis.
📏 Adjustable Unit Display : Easily manage the magnitude of the values displayed with options like "1 Billion", "1 Million", "1 Thousand", or "None".
🔧 Lookback Period Customization : Tailor the sum calculation window with a configurable lookback period, applicable in "Sum of Flows" mode.
📊 Deviation Thresholds : Set up lower and upper deviation thresholds to identify significant changes in flow data.
🔄 Reversal Signals and Deviation Bands : Enable signals for potential reversals and visualize deviation bands for comparative analysis.
🎨 Color-coded Visualization : Distinct colors for upward and downward movements make it easy to distinguish between buying and selling pressures.
🚀 Quick Guide to Using the Net Buying/Selling Flows Toolkit :
🔍 Add the Indicator : Add the indicator to you favorites. Customize the settings to fit your trading requirements.
👁️🗨️ Data Analysis : Compare the trend of Buying and Selling to help indicate whether bulls or bears are in control of the market. Utilize the different display modes to present the data in different form to suite your analysis style.
🔔 Set Alerts : Activate alerts for reversal conditions to keep abreast of significant market movements without having to monitor the charts constantly.
🌐 How It Works :
The toolkit processes volume data on a lower timeframe to distinguish between buying and selling pressures based on intra-bar price closing higher or lower than it opened. It aggregates these transactions and finds the net selling and buying that took place during that bar, offering a clearer view of market fundamentals. The indicator then plots this data visually with multiple modes including comparisons between buying/selling and the net flow of the asset. Deviation thresholds help in identifying significant changes, allowing traders to spot potential buying or selling opportunities based on the money flow dynamics. The "Sum of Flows" mode is unique from other trend following indicators as it does not determine trend based on price action, but rather based on the net buying/selling. Therefore in some cases the "Sum of Flows" mode can be a leading indicator showing bullish/bearish net flows even before the prices move significantly.
Embark on a more informed trading journey with this dynamic and insightful tool, tailor-made for those who demand precision and clarity in their trading strategies. 🌟📉📈

Price Strength Index + RSI Buy/Sell ZonesThe Price Strength Index + RSI Buy/Sell Zones indicator is a technical analysis tool designed to evaluate the strength of a financial asset's price movement by comparing it with a series of Volume Weighted Moving Averages (VWMAs) of different lengths calculated from historical data.
Hypothesis :
The core hypothesis behind this indicator is that assessing the relationship between the current price and a range of VWMAs with varying lengths can provide valuable insights into the strength and direction of a price trend. Additionally, it incorporates Relative Strength Index (RSI) conditions to further refine potential buy and sell signals.
How It Works :
Multiple VWMA Calculation: The indicator calculates multiple VWMAs, each with a different length, using historical price data and volume. These VWMAs represent weighted moving averages over various periods, helping to capture different aspects of the price trend.
Comparison with Current Price : For each of these VWMAs, the indicator compares the current bar's price with the VWMA value. This comparison is crucial in understanding how the current price relates to historical averages, shedding light on the strength and direction of the prevailing trend.
SMA of Percentage Above VWMA : The indicator calculates the Simple Moving Average (SMA) of the percentage of prices above the various VWMAs over a specified period. This moving average smoothens out the percentage data, providing a clearer trend signal.
Buy and Sell Zones : User-defined upper and lower thresholds for the percentage of prices above the VWMAs are used to define buy and sell zones. When the percentage falls below the lower threshold, it signals a potential buy zone, suggesting a weakening trend. Conversely, when it exceeds the upper threshold, it signifies a potential sell zone, indicating a strengthening trend.
RSI Integration : The RSI is calculated for the selected price source with a specified length. When the SMA of the percentage above VWMAs falls within the buy zone and the RSI is below the lower RSI threshold, it indicates an oversold condition, potentially signaling a buy opportunity. Conversely, when the SMA falls within the sell zone and the RSI is above the upper RSI threshold, it suggests an overbought condition, possibly signaling a sell opportunity.
Color Coding : The indicator employs color-coding to visually represent the buy and sell zones, as well as extreme RSI conditions. Green color denotes the buy zone, red represents the sell zone, and orange lines indicate the median and potential reversal points.
In summary, the Price Strength Index + RSI Buy/Sell Zones indicator leverages multiple VWMAs of different lengths to assess the relationship between current prices and historical moving averages. This comprehensive analysis, coupled with RSI conditions, aids traders in identifying potential buy and sell zones, as well as extreme RSI points within those zones, enhancing the evaluation of price strength and potential trend reversals.

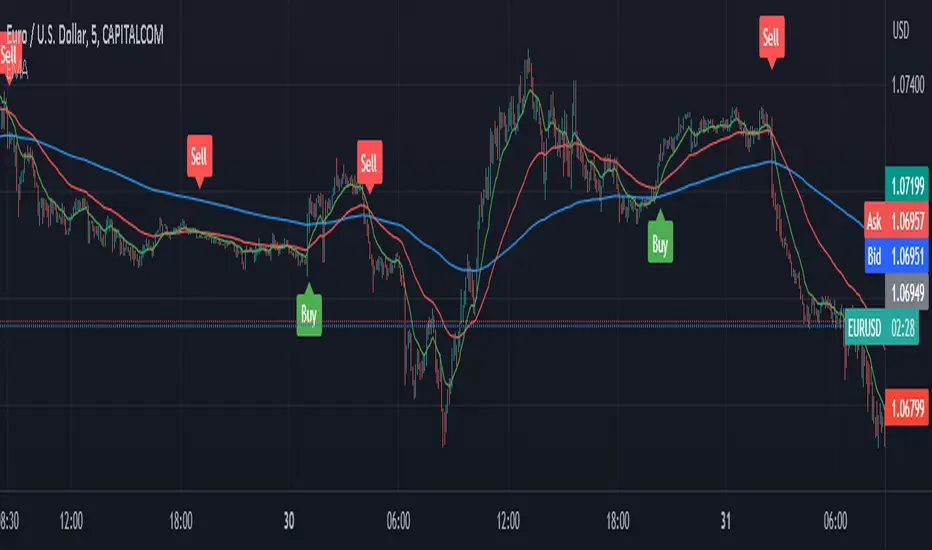
EMA with Buy/Sell Signals by lbkindCertainly! Here's a description of the code:
This Pine Script code is designed to plot Exponential Moving Averages (EMAs) on a chart and generate buy/sell signals based on specific conditions. The code includes a filter to reduce false signals by considering the trend of the EMA 200.
The key components of the code are as follows:
1. Input Variables: The code starts by defining input variables such as the periods for the EMAs (ema200Period, ema50Period, ema13Period), the Average True Range period (atrPeriod), and the chopiness threshold (chopinessThreshold).
2. Calculating EMAs: The EMAs (ema200, ema50, ema13) are calculated using the `ema()` function based on the closing price.
3. Average True Range (ATR): The ATR is calculated using the `atr()` function with the specified period (atrPeriod).
4. Normalized ATR: The normalized ATR is computed by dividing the ATR by the closing price and multiplying by 100. This allows for better comparison across different price levels.
5. EMA 200 Trend Direction: The code determines the trend direction of the EMA 200 by comparing the current value with the previous value. The variables `ema200TrendUp` and `ema200TrendDown` are assigned `true` or `false` values based on the trend direction.
6. Generate Buy/Sell Signals: The buySignal is generated when the following conditions are met:
- There is a crossover of the shorter EMAs (ema13, ema50).
- The EMA 200 is in an uptrend (`ema200TrendUp` is true).
- The current close is above the EMA 200.
- The normalized ATR is below the specified chopiness threshold.
The sellSignal is generated when the opposite conditions are met.
7. Plotting: The EMAs (ema200, ema50, ema13) are plotted on the chart using the `plot()` function. The buy and sell signals are plotted as labels using the `plotshape()` function. The buySignal is displayed below the candle (`location=location.belowbar`), and the sellSignal is displayed above the candle (`location=location.abovebar`).
By incorporating these features, the code provides a visual representation of the EMAs, along with buy and sell signals that consider the EMA 200 trend, crossover of shorter EMAs, and the normalized ATR condition. This helps in identifying potential entry and exit points in the market while attempting to reduce false signals.
Buying and Selling Pressure Raw Multi (TG Fork)Visualize raw buying and selling pressure via 3 different calculation methods, all superimposed with dynamic rescaling.
Buying and selling pressure is the concept of quantifying the disproportion between buying and selling. In practice, there is no single definitive way to calculate it.
This indicator is a merge to display three different methods to calculate buying and selling pressure, with automatic visual rescaling to superimpose the three simultaneously, updated to PineScript v5, and with some additional improvements for speed and calculation precisions, and instead of the EMA, other types of moving averages can be used.
I primarily made it for my own needs, but as always, I like sharing with the community, as maybe others may find this useful too.
How to use:
* As often, the goal is to get as many of the 3 signals concur together to get a stronger aggregated signal.
* First signal: If the green bars on the histogram are bigger than the red ones, then there is more buying pressure, and vice versa.
* Second signal: If the background is green, there is more buying pressure, and vice versa if the background is orange. The yellow and green lines define the background color, but they are by default hidden for a less cluttered visual experience.
* Third signal: If the cloud is blue, there is more buying pressure, and the bigger the cloud, the more momentum there is for it to stay (and more difficult it is to reverse to selling pressure). If the cloud is red, there is more selling pressure.
If you like this indicator, please don't give me any credit, instead please show some love to the original authors (in no particular order):
ceyhun:
daytraderph (I could not find the link to the original script, the page is inaccessible?):
www.tradingview.com
fract:

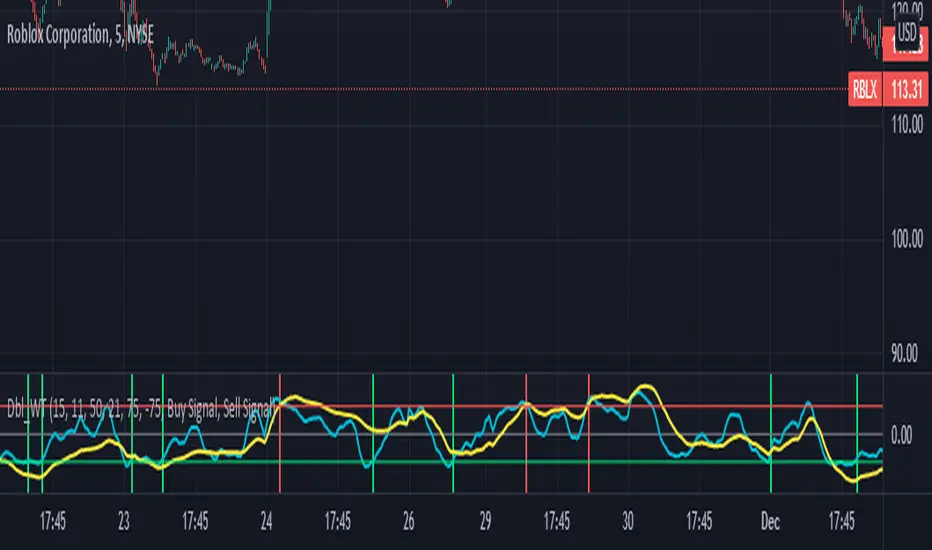
Double wave-trend Oscillator Buy/Sell signalsBINANCE:ROSEUSDT
This script attempts to use Wave Trend Oscillator's of different lengths in order to identify trade entries and exits for bullish trades. This indicator is strongly recommended to be used with volatile assets or on large time interval charts. You use this script by entering a trade when it signals a green block and exiting when it signals red although these signals could potentially be used as trend reversal signals instead. The script uses two wave trend oscillator's the lengths of which can be edited in the settings, but the general idea is that one is fast and one is slow and these indicate when to buy/sell when they crossover the overbought/sold lines. In the setting you can choose whether the fast or the slow line will be used for buy signal and the other is then used to signal selling. By default this will be ticked on indicating that the fast line crossing over the oversold level will be used for buy signals, if it is ticked off the slow line will be used. The other tickbox is for whether the line used for selling will signal when it first crosses over the overbought line or whether it should signal then it crosses back under the overbought line after having crossed over it, the default value is off indicating that it will signal when it crosses back under the overbought level. The overbought/sold levels should be tweaked on a per asset basis to get the best quality signals.
The original code for the Wave Trend Oscillator comes from LazyBear and was modified and built on to create this indicator.
Vol Buy/Sell %s, CMF, and Stocahstic Osc & UOPlots % Buy / Sell Volume , Chaikin Money Flow , Stochastic Oscillator, and Ultimate Oscillator on same axis, bound -1 to 1.
Show Volume Percentage, displaying buying as green and positive, selling as red and negative.
Showing the CMF, with green / red fill for positive / negative values.
Modified Stochastic Oscillator, converting bounds to -1 and 1, moving overbought/sold to -0.6 and 0.6, accordingly. Green fill (buy signal) with %D below -0.6 and %K lower than %D. Red fill (sell signal) with %D above 0.6 and %K higher than %D. Fill is between %D and bound, to be more visible.
Modified Ultimate Oscillator, converting bounds to -1 and 1, moving overbought/sold to -0.6 and 0.6, accordingly.

KINSKI Buy-Sell Signal"KINSKI Buy-Sell Signal" is an Average True Range (ATR) based trailing stop indicator.
In this version, you can change the ATR calculation method using the settings. The default method is hlc3. The HLC stands for High, Low, Close and the /3 divides the result by 3 to give you the average.
The indicator calculates the buy and sell signals using HLC3, Simple Moving Average ( SMA ) and the Exponential Moving Average ( EMA ) as soon as they cross. This indicator is useful with time intervals starting at 15m.
Have fun with it and be careful when buying and selling!
Example Chart:

[NBK] Cover Buy Sell for BTC Cover Buy Sell for BTC— Engulfing Reversals with EMA/ATR Trend & Quality Filters
{Update for BTC}
What it does
This indicator flags high-quality bullish/bearish reversal candles only when they align with a short-term trend and pass several objective quality filters. It is not a simple mashup: each component serves a distinct role and they work together to keep early/low-quality signals out.
How it works (components & interaction)
Pattern engine (entry candidates)
Bullish side (Cover Buy):
Body Engulf: current green body fully covers the prior red body, or
Piercing (relaxed): prior red → current green closes above the prior body’s midpoint (not beyond prior open).
Bearish side (Cover Sell):
Full-candle Engulf: current red candle (body + wicks) covers the entire prior candle, or
Body Engulf: current red body fully covers the prior body, or
Dark-Cloud (relaxed): prior green → current red closes below the prior body’s midpoint.
Short-term trend gate (non-repainting)
Trend is defined by the EMA slope between bar-1 and bar-2, scaled by ATR to require minimum strength.
Slope < 0 → only bullish candidates pass. Slope > 0 → only bearish candidates pass.
Body-size filter (noise control)
Rejects tiny candles: each body is compared with the lookback average body size.
For bearish candidates an additional ratio check requires current body ≥ a fraction of the prior body (to avoid weak top-ticks).
Peak filters for bearish signals (late, cleaner tops)
Distance above EMA: the high must be at least X × ATR above EMA (avoids mid-range noise).
Near local high: the high of the current bar (or bar-1) must be close to the highest high in a recent window.
Break confirmation: close must break low by at least Y × ATR (filters shallow dark-clouds).
Only when a candidate satisfies the pattern ➝ trend ➝ size ➝ peak sequence is a signal printed/alerted.
Inputs (key parameters)
EMA length, Min EMA slope vs ATR, ATR length: trend strength.
Lookback for average body, Min body vs average, Bear body ratio: body-quality filters.
High distance above EMA (×ATR), Local high lookback, Tolerance to local high (×ATR), Min break of low (×ATR): bearish peak confirmation.
Alerts
Built-in alerts fire on bar close for both Cover Buy and Cover Sell.
How to use
Increase High distance above EMA / Local high lookback / Min break of low to reduce early Cover Sell in ranges.
If you miss good tops, ease those thresholds slightly.
Works across symbols/timeframes; evaluated on bar close; no repaint from the trend gate.
Notes
This tool is a signal screener, not financial advice. For best results, combine with your structure/SR zones, risk management, and execution rules.
13 thg 10
Phát hành các Ghi chú
Cover Buy Sell — Engulfing Reversals with EMA/ATR Trend & Quality/Peak Filters
What this script does
Flags high-quality bullish/bearish engulfing reversals only when short-term trend and price-action quality conditions are met. Signals evaluate on bar close. No promotions, no links, no external calls.
Why this is an original combination (mashup justification)
Raw engulfing patterns are noisy in ranges. This script is a pipeline where each module solves a specific failure mode, not a simple merge of indicators:
Pattern engine (candidates):
Bullish (Cover Buy): body-engulf of prior red body, or relaxed Piercing (close above prior body midpoint, not beyond prior open).
Bearish (Cover Sell): full-candle engulf (body+wicks), body-engulf, or relaxed Dark-Cloud (close below prior body midpoint).
Short-term trend gate (non-repainting):
EMA slope is measured between bar-1 and bar-2 and must exceed an ATR-scaled threshold (slopeAtrPct).
Slope < 0 → only bullish candidates pass.
Slope > 0 → only bearish candidates pass.
Body-size filter (noise control):
Bodies must not be tiny vs the average over lenBodyRef. For bearish candidates, an alternate check allows current body ≥ bearRatioMin × prior body to keep decisive tops.
Bearish peak filters (late, cleaner tops):
High must be far above EMA (≥ emaDistAtrMin × ATR), near the local high (current or prior bar within nearHighLen & nearHighTol × ATR), and the close must break prior low by ≥ breakAtrMin × ATR.
These remove premature Cover Sell flags in chop and keep the later, higher-quality reversal.
Only candidates that pass Pattern → Trend → Size → Peak become signals. This staged design is the core originality.
How to use (practical guidance)
To reduce early Cover Sell in ranges: raise emaDistAtrMin, raise nearHighLen, and/or raise breakAtrMin.
If you miss clean tops: slightly lower those thresholds.
Typical starting points: lenTrend=4–6, slopeAtrPct=0.03–0.06, atrLen=14; adjust to instrument/TF volatility.
Combine with structure/SR zones and your risk rules. This tool is for analysis only and is not investment advice.
Alerts
Two alert conditions are included: Cover Buy and Cover Sell, both evaluated on bar close.
Non-repainting note
The trend gate uses confirmed data (EMA slope from bar-1 vs bar-2). Pattern and filters also use confirmed values; no forward-looking references.
English translations of UI strings (if your on-chart UI uses another language)
“Strict engulf (không cho bằng nhau)” → Strict engulf (no equality)
“EMA length (trend ngắn hạn)” → EMA length (short-term trend)
“Lookback tính thân trung bình” → Lookback for average body size
“Ngưỡng thân tối thiểu vs trung bình” → Min body vs average (ratio)
“Bear: thân hiện tại ≥ rRatio * thân trước” → Bear: current body ≥ rRatio × prior body
“Bear: HIGH cách EMA tối thiểu (x ATR)” → Bear: HIGH distance above EMA (× ATR) min
“Bear: cửa sổ đỉnh cục bộ (bars)” → Bear: local high lookback (bars)
“Bear: dung sai tới đỉnh (x ATR)” → Bear: tolerance to local high (× ATR)
“Bear: mức phá LOW tối thiểu (x ATR)” → Bear: min break of LOW (× ATR)
Compliance notes
English-only title, English appears first in this description; no ads, logos, links, or solicitations.
This is an original, closed-source script with a meaningful explanation of what, how, why, and how to use.
(Vietnamese short summary)
Chỉ báo bắt tín hiệu engulfing chất lượng cao khi có xu hướng EMA ngắn hạn (đo bằng độ dốc/ATR) và vượt qua lọc kích thước thân + điều kiện đỉnh cho tín hiệu bán. Chuỗi xử lý Mẫu → Xu hướng → Kích thước → Đỉnh giúp loại tín hiệu sớm trong vùng đi ngang. Có alert Cover Buy/Sell, đánh giá theo bar close, không quảng cáo/đường link, và không phải khuyến nghị đầu tư.

[NBK] Cover Buy Sell for XAU Cover Buy Sell for XAU — Engulfing Reversals with EMA/ATR Trend & Quality Filters
{Update for XAU}
What it does
This indicator flags high-quality bullish/bearish reversal candles only when they align with a short-term trend and pass several objective quality filters. It is not a simple mashup: each component serves a distinct role and they work together to keep early/low-quality signals out.
How it works (components & interaction)
Pattern engine (entry candidates)
Bullish side (Cover Buy):
Body Engulf: current green body fully covers the prior red body, or
Piercing (relaxed): prior red → current green closes above the prior body’s midpoint (not beyond prior open).
Bearish side (Cover Sell):
Full-candle Engulf: current red candle (body + wicks) covers the entire prior candle, or
Body Engulf: current red body fully covers the prior body, or
Dark-Cloud (relaxed): prior green → current red closes below the prior body’s midpoint.
Short-term trend gate (non-repainting)
Trend is defined by the EMA slope between bar-1 and bar-2, scaled by ATR to require minimum strength.
Slope < 0 → only bullish candidates pass. Slope > 0 → only bearish candidates pass.
Body-size filter (noise control)
Rejects tiny candles: each body is compared with the lookback average body size.
For bearish candidates an additional ratio check requires current body ≥ a fraction of the prior body (to avoid weak top-ticks).
Peak filters for bearish signals (late, cleaner tops)
Distance above EMA: the high must be at least X × ATR above EMA (avoids mid-range noise).
Near local high: the high of the current bar (or bar-1) must be close to the highest high in a recent window.
Break confirmation: close must break low by at least Y × ATR (filters shallow dark-clouds).
Only when a candidate satisfies the pattern ➝ trend ➝ size ➝ peak sequence is a signal printed/alerted.
Inputs (key parameters)
EMA length, Min EMA slope vs ATR, ATR length: trend strength.
Lookback for average body, Min body vs average, Bear body ratio: body-quality filters.
High distance above EMA (×ATR), Local high lookback, Tolerance to local high (×ATR), Min break of low (×ATR): bearish peak confirmation.
Alerts
Built-in alerts fire on bar close for both Cover Buy and Cover Sell.
How to use
Increase High distance above EMA / Local high lookback / Min break of low to reduce early Cover Sell in ranges.
If you miss good tops, ease those thresholds slightly.
Works across symbols/timeframes; evaluated on bar close; no repaint from the trend gate.
Notes
This tool is a signal screener, not financial advice. For best results, combine with your structure/SR zones, risk management, and execution rules.
13 thg 10
Phát hành các Ghi chú
Cover Buy Sell — Engulfing Reversals with EMA/ATR Trend & Quality/Peak Filters
What this script does
Flags high-quality bullish/bearish engulfing reversals only when short-term trend and price-action quality conditions are met. Signals evaluate on bar close. No promotions, no links, no external calls.
Why this is an original combination (mashup justification)
Raw engulfing patterns are noisy in ranges. This script is a pipeline where each module solves a specific failure mode, not a simple merge of indicators:
Pattern engine (candidates):
Bullish (Cover Buy): body-engulf of prior red body, or relaxed Piercing (close above prior body midpoint, not beyond prior open).
Bearish (Cover Sell): full-candle engulf (body+wicks), body-engulf, or relaxed Dark-Cloud (close below prior body midpoint).
Short-term trend gate (non-repainting):
EMA slope is measured between bar-1 and bar-2 and must exceed an ATR-scaled threshold (slopeAtrPct).
Slope < 0 → only bullish candidates pass.
Slope > 0 → only bearish candidates pass.
Body-size filter (noise control):
Bodies must not be tiny vs the average over lenBodyRef. For bearish candidates, an alternate check allows current body ≥ bearRatioMin × prior body to keep decisive tops.
Bearish peak filters (late, cleaner tops):
High must be far above EMA (≥ emaDistAtrMin × ATR), near the local high (current or prior bar within nearHighLen & nearHighTol × ATR), and the close must break prior low by ≥ breakAtrMin × ATR.
These remove premature Cover Sell flags in chop and keep the later, higher-quality reversal.
Only candidates that pass Pattern → Trend → Size → Peak become signals. This staged design is the core originality.
How to use (practical guidance)
To reduce early Cover Sell in ranges: raise emaDistAtrMin, raise nearHighLen, and/or raise breakAtrMin.
If you miss clean tops: slightly lower those thresholds.
Typical starting points: lenTrend=4–6, slopeAtrPct=0.03–0.06, atrLen=14; adjust to instrument/TF volatility.
Combine with structure/SR zones and your risk rules. This tool is for analysis only and is not investment advice.
Alerts
Two alert conditions are included: Cover Buy and Cover Sell, both evaluated on bar close.
Non-repainting note
The trend gate uses confirmed data (EMA slope from bar-1 vs bar-2). Pattern and filters also use confirmed values; no forward-looking references.
English translations of UI strings (if your on-chart UI uses another language)
“Strict engulf (không cho bằng nhau)” → Strict engulf (no equality)
“EMA length (trend ngắn hạn)” → EMA length (short-term trend)
“Lookback tính thân trung bình” → Lookback for average body size
“Ngưỡng thân tối thiểu vs trung bình” → Min body vs average (ratio)
“Bear: thân hiện tại ≥ rRatio * thân trước” → Bear: current body ≥ rRatio × prior body
“Bear: HIGH cách EMA tối thiểu (x ATR)” → Bear: HIGH distance above EMA (× ATR) min
“Bear: cửa sổ đỉnh cục bộ (bars)” → Bear: local high lookback (bars)
“Bear: dung sai tới đỉnh (x ATR)” → Bear: tolerance to local high (× ATR)
“Bear: mức phá LOW tối thiểu (x ATR)” → Bear: min break of LOW (× ATR)
Compliance notes
English-only title, English appears first in this description; no ads, logos, links, or solicitations.
This is an original, closed-source script with a meaningful explanation of what, how, why, and how to use.
(Vietnamese short summary)
Chỉ báo bắt tín hiệu engulfing chất lượng cao khi có xu hướng EMA ngắn hạn (đo bằng độ dốc/ATR) và vượt qua lọc kích thước thân + điều kiện đỉnh cho tín hiệu bán. Chuỗi xử lý Mẫu → Xu hướng → Kích thước → Đỉnh giúp loại tín hiệu sớm trong vùng đi ngang. Có alert Cover Buy/Sell, đánh giá theo bar close, không quảng cáo/đường link, và không phải khuyến nghị đầu tư.

VietNguyen Buy/Sell VIPThis is indicator of VietNammes, it is very good for trade Gold and Crypto.
VietNguyen DN

Algo Trading Signals - Buy/Sell System# 📊 Algo Trading Signals - Dynamic Buy/Sell System
## 🎯 Overview
**Algo Trading Signals** is a sophisticated intraday trading indicator designed for algorithmic traders and active day traders. This system generates precise buy and sell signals based on a dynamic box breakout strategy with intelligent position management, add-on entries, and automatic target adjustment.
The indicator creates a reference price box during a specified time window (default: 9:15 AM - 9:45 AM IST) and generates high-probability signals when price breaks out of this range with confirmation.
---
## ✨ Key Features
### 📍 **Smart Signal Generation**
- **Primary Entry Signals**: Clear buy/sell signals on confirmed breakouts above/below the reference box
- **Confirmation Bars**: Reduces false signals by requiring multiple bar confirmation before entry
- **Cooldown System**: Prevents overtrading with configurable cooldown periods between trades
- **Add-On Positions**: Automatically identifies optimal pullback entries for scaling into positions
### 📦 **Dynamic Reference Box**
- Creates a high/low range during your chosen time window
- Automatically updates after each successful trade
- Visual box display with color-coded boundaries (red=resistance, green=support)
- Mid-level reference line for market structure analysis
### 🎯 **Intelligent Position Management**
- **Automatic Target Calculation**: Sets profit targets based on average move distance
- **Add-On System**: Up to 3 additional entries on optimal pullbacks
- **Position Tracking**: Monitors active trades and remaining add-on capacity
- **Auto Box Shift**: Adjusts reference box after target hits for continued trading
### 📊 **Visual Clarity**
- **Color-Coded Labels**:
- 🟢 Green for BUY signals
- 🔴 Red for SELL signals
- 🔵 Blue for ADD-ON buys
- 🟠 Orange for ADD-ON sells
- ✓ Yellow for Target hits
- **TP Level Lines**: Dotted lines showing current profit targets
- **Hover Tooltips**: Detailed information on entry prices, targets, and add-on numbers
### 📈 **Real-Time Statistics**
Live performance dashboard showing:
- Total buy and sell signals generated
- Number of add-on positions taken
- Take profit hits achieved
- Current trade status (LONG/SHORT/None)
- Cooldown timer status
### 🔔 **Comprehensive Alerts**
Built-in alert conditions for:
- Primary buy entry signals
- Primary sell entry signals
- Add-on buy positions
- Add-on sell positions
- Buy take profit hits
- Sell take profit hits
---
## 🛠️ Configuration Options
### **Time Settings**
- **Box Start Hour/Minute**: Define when to begin tracking the reference range
- **Box End Hour/Minute**: Define when to lock the reference box
- **Default**: 9:15 AM - 9:45 AM (IST) - Perfect for Indian market opening range
### **Trade Settings**
- **Target Points (TP)**: Average move distance for profit targets (default: 40 points)
- **Breakout Confirmation Bars**: Number of bars to confirm breakout (default: 2)
- **Cooldown After Trade**: Bars to wait after closing position (default: 3)
- **Add-On Distance Points**: Minimum pullback for add-on entry (default: 40 points)
- **Max Add-On Positions**: Maximum additional positions allowed (default: 3)
### **Display Options**
- Toggle buy/sell signal labels
- Show/hide trading box visualization
- Show/hide TP level lines
- Show/hide statistics table
---
## 💡 How It Works
### **Phase 1: Box Formation (9:15 AM - 9:45 AM)**
The indicator tracks the high and low prices during your specified time window to create a reference box representing the opening range.
### **Phase 2: Breakout Detection**
After the box is locked, the system monitors for:
- **Bullish Breakout**: Price closes above box high for confirmation bars
- **Bearish Breakout**: Price closes below box low for confirmation bars
### **Phase 3: Signal Generation**
When confirmation requirements are met:
- Entry signal is generated with clear visual label
- Target price is calculated (Entry ± Target Points)
- Position tracking activates
- Cooldown timer starts
### **Phase 4: Position Management**
During active trade:
- **Add-On Logic**: If price pulls back by specified distance but stays within favorable range, additional entry signal fires
- **Target Monitoring**: Continuously checks if price reaches TP level
- **Box Adjustment**: After TP hit, box automatically shifts to new range for next opportunity
### **Phase 5: Trade Exit & Reset**
On target hit:
- Position closes with TP marker
- Statistics update
- Box repositions for next setup
- Cooldown activates
- System ready for next signal
---
## 📌 Best Use Cases
### **Ideal For:**
- ✅ Intraday breakout trading strategies
- ✅ Algorithmic trading systems (via alerts/webhooks)
- ✅ Opening range breakout (ORB) strategies
- ✅ Index futures (Nifty, Bank Nifty, Sensex)
- ✅ High-liquidity stocks with clear ranges
- ✅ Automated trading bots
- ✅ Scalping and day trading
### **Markets:**
- Indian Stock Market (NSE/BSE)
- Futures & Options
- Forex pairs
- Cryptocurrency (adjust timing for 24/7 markets)
- Global indices
---
## ⚙️ Integration with Algo Trading
This indicator is **algo-ready** and can be integrated with automated trading systems:
1. **TradingView Alerts**: Set up alert conditions for each signal type
2. **Webhook Integration**: Connect alerts to trading platforms via webhooks
3. **API Automation**: Use with brokers supporting TradingView integration (Zerodha, Upstox, Interactive Brokers, etc.)
4. **Signal Data Access**: All signals are plotted for external data retrieval
---
## 📖 Quick Start Guide
1. **Add Indicator**: Apply to your chart (works best on 1-5 minute timeframes)
2. **Configure Time Window**: Set your desired box formation period
3. **Adjust Parameters**: Tune confirmation bars, targets, and add-on settings to your trading style
4. **Set Alerts**: Create alert conditions for automated notifications
5. **Backtest**: Review historical signals to validate strategy performance
6. **Go Live**: Enable alerts and start receiving real-time trading signals
---
## ⚠️ Risk Disclaimer
This indicator is a **tool for analysis** and does not guarantee profits. Trading involves substantial risk of loss. Always:
- Use proper position sizing
- Implement stop losses (not included in this indicator)
- Test thoroughly before live trading
- Understand market conditions
- Never risk more than you can afford to lose
- Consider your risk tolerance and trading experience
**Past performance does not indicate future results.**
## 🔄 Version History
**v1.0** - Initial Release
- Dynamic box formation system
- Confirmed breakout signals
- Add-on position management
- Visual signal labels and statistics
- Comprehensive alert system
- Auto-adjusting target boxes
---
## 📞 Support & Feedback
If you find this indicator helpful:
- ⭐ Please leave a like/favorite
- 💬 Share your feedback in comments
- 📊 Share your results and improvements
- 🤝 Suggest features for future updates
---
## 🏷️ Tags
`breakout` `daytrading` `signals` `algo` `automated` `intraday` `ORB` `opening-range` `buy-sell` `scalping` `futures` `nifty` `banknifty` `algorithmic` `box-strategy`
*Remember: The best indicator is combined with proper risk management and trading discipline.* Use it at your own rist, not as financial advie

SuperTrend V · AI Buy/Sell超级趋势 V · AI 买卖 + 止盈提示简介 / Overview
中文:
本指标在经典 SuperTrend 上加入了体量价差(VPT)平滑与“参考均线”过滤,给出 AI 买入/卖出 信号(规则化的过滤逻辑,非机器学习),并在价格触及动态止盈通道时打出 “止盈” 圆点。每笔信号之间自动跟踪并标注 峰值收益(可显示杠杆倍数),用于回顾交易潜在的最大浮盈。适合趋势/波段交易与告警联动。
English:
This indicator enhances classic SuperTrend with VPT-style smoothing and a reference EMA filter to emit AI Buy/Sell signals (rule-based, not ML). It plots TP dots when price hits a dynamic take-profit channel and labels the Peak Profit reached between opposite signals (with optional leverage display). Designed for trend/swing trading and alerts.
使用方法 / How to Use
中文:
将指标加到任意品种图表(默认 15 分钟~4 小时均可)。
观察两条“参考均线”:红线=参考均线、蓝线=开盘均线。当红线在蓝线上方时偏多,反之偏空(图中填充区也会切色)。
AI 买入:价格向上穿越 SuperTrend 线,且收盘价位于蓝线之上;AI 卖出:价格向下穿越 SuperTrend 线,且收盘价位于蓝线之下。
出现 “止盈” 圆点(TP)代表价格触达动态带(基于线性回归+σ通道)。可作为分批止盈/加减仓的参考。
当下一次出现相反方向的 AI 信号时,会在本轮交易的峰值位置打出 “峰值收益 xx% (100x)” 标签,用于复盘。
需要自动提醒:在图表右键 → “添加告警”,选择本指标并挑选相应条件(见“告警条件”)。
English:
Add the indicator to any symbol/timeframe (15m–4h recommended).
Use the two reference EMAs (red = reference, blue = open EMA). Red above blue favors long bias and vice versa.
AI Buy: price crosses above the SuperTrend line and closes above the blue EMA. AI Sell: crosses below and closes below the blue EMA.
TP dots appear when price touches the dynamic channel (linear-regression VWAP ± σ). Use them for partial take-profit or scaling.
On the next opposite AI signal, a Peak Profit xx% (100x) label is placed at the highest/lowest excursion for review.
For alerts: Right-click chart → “Add Alert” → choose this script and a condition (see “Alert conditions”).
主要参数 / Key Inputs
中文:
参考时间框架(分钟):用于参考均线与平滑的更高周期(默认 720 分=12H)。
SuperTrend 乘数 / 周期:决定 ST 线的灵敏度与带宽;乘数越小越敏感。
止盈倍数(σ)、止盈窗口长度:决定 TP 圆点通道的宽度与回溯长度。
显示峰值收益标签、杠杆(仅用于文本显示):是否显示“峰值收益”,以及标签内显示的 x 倍数。
English:
Reference timeframe (minutes) for smoothing/EMAs (default 720 = 12H).
SuperTrend Multiplier / Period control sensitivity and band width.
TP Sigma, TP Window Length define the dynamic channel.
Show Peak Profit, Leverage (text only) toggle the label and x-multiplier text.
告警条件 / Alert Conditions
中文:买入、卖出、卖出止盈触发(低位 TP)、买入止盈触发(高位 TP)。
English: Buy, Sell, TP on Short (low band cross up), TP on Long (upper band cross down).
参数建议 / Tuning Tips
中文:
加密 15m:ST 乘数 1.0~1.5、周期 10~14;TP σ=2、窗口 100~200。
趋势强:可增大乘数/窗口,减少噪音;震荡多:减小乘数/窗口,提高敏感度但留意假信号。
English:
Crypto 15m: ST mult 1.0–1.5, period 10–14; TP σ=2, window 100–200.
Strong trend: increase mult/window to cut noise. Choppy: decrease for responsiveness (watch for whipsaw).
交易提示 / Trading Notes
中文:AI 标签仅为规则化过滤,不代表模型预测;建议结合更大周期方向与量能确认。止盈圆点可做分批减仓,切勿仅依赖单一信号。
English: “AI” labels are rule-based filters, not ML predictions. Combine with higher-TF bias/volume. Use TP dots for scaling; avoid single-signal decisions.

Volume with Buying/Selling PowerUnlock deeper market insights with this volume indicator that goes beyond basic volume analysis:
- Buying & Selling Volume Breakdown: Distinguishes between buying and selling pressure so you can spot real shifts in market sentiment.
- Adaptive Volume Coloring: Bars colored by previous close or buy/sell balance for instant clarity.
- Volume Power Signals: Visualizes buying and selling volume power using both raw and normalized calculations.
- Buy/Sell Ratio Coloring: Optionally color bars based on relative buy/sell strength for quick visual cues.

SeikaAlgo–Long/Short Buy/Sell SignalSeikaAlgo–Long/Short Buy/Sell Signal — Simple, Visual, Reliable Signals
SeikaAlgo makes high-probability trading simple and actionable for everyone—no complex rules, no guesswork. Just follow these 3 steps:
How It Works
1. Watch for Buy/Sell Signals
Buy and Sell signals are printed right on your chart, only after the candle closes—never repaints, never lags. Trade with confidence.
2. Enter at Candle Close
Buy: Enter at the close of a candle when a green “B” label appears and price crosses above the green EMA 9.
Sell: Enter at the close of a candle when a red “S” label appears and price crosses below the red EMA 9.
3. Take Profit
Move your stop loss with each new candle (trailing stop), or use the EMA 9 line to trail stops.
Take profit when price reaches a Daily Fibonacci Level.
Example — 5min SPY
Buy Signal: Green label prints above green EMA 9 after candle closes. Enter at close, stop just below the signal candle’s low.
Sell Signal: Red label prints below red EMA 9 after candle closes. Enter at close, stop just above the signal candle’s high.
Key Features
No Lag, No Repainting: Signals only appear after a candle is complete—so you’re never chasing ghosts.
Clear Visual Cues: Instantly know when to buy, sell, or step aside.
Built-in Trailing Stop Logic: Protect your trades easily.
Works On Any Market/Timeframe: Perfect for stocks, futures, crypto, or forex.
SeikaAlgo is an invite-only indicator.
Add it to your chart, follow the labels and EMA, and trade with confidence—no clutter, no confusion. Simple, visual, reliable.

PKSE Buy/Sell Signals Table - Two Columns with VWAPndicator Description: PKSE Buy/Sell Signals Table - Two Columns with VWAP
Overview
The PKSE Buy/Sell Signals Table - Two Columns with VWAP is a robust Pine Script indicator for Pakistan Stock Exchange (PSX) traders. It generates buy and sell signals for 19 PSX stocks based on Simple Moving Average (SMA) crossovers, KSE100 Index trends, and daily Volume Weighted Average Price (VWAP) conditions, displayed in two compact, side-by-side tables optimized for monitor viewing.
Purpose
This indicator helps traders identify high-probability trading opportunities by filtering signals with VWAP to reduce noise, ideal for swing traders, day traders, and investors monitoring PSX stocks.
Key Features
Dual-Table Layout: Displays 19 stocks in two side-by-side tables (10 and 9 stocks) for a monitor-friendly view.
Enhanced Signal Logic: Combines three conditions:
KSE100 Trend: Signals depend on the KSE100 Index being above/below its SMA.
Stock SMA: Signals based on stock price crossing or being above/below its SMA.
Daily VWAP Filter: Buy signals require the stock to be above its daily VWAP; sell signals require it to be below.
Signal Types:
Buy NOW: Stock crosses above SMA, KSE100 is bullish, stock above VWAP.
Buy: Stock above SMA, KSE100 bullish, stock above VWAP.
Sell NOW: Stock crosses below SMA, KSE100 bearish, stock below VWAP.
Sell: Stock below SMA, KSE100 bearish, stock below VWAP.
Neutral: Conditions not fully met.
No Data: Invalid or missing data.
Customizable Inputs:
SMA length (default: 5).
Timeframe (5, 15, 30, 60 minutes, daily; default: 30 minutes).
KSE100 symbol (default: "PSX:KSE100").
Color-Coded Signals: Green (Buy), lime (Buy NOW), red (Sell), orange (Sell NOW), gray (No Data), white (Neutral).
Stock Coverage: Tracks 19 PSX stocks (e.g., FFC, OGDC, HUBC, UBL, MCB, LUCK).
Error Handling: Handles invalid symbols or missing data with "No Data" signals.
How It Works
Fetches KSE100 and stock prices in the selected timeframe (default: 30 minutes) and daily VWAP.
Calculates SMA for KSE100 and stocks; evaluates VWAP position.
Generates signals when all conditions align, based on the 30-minute candle close.
Displays results in two tables (Stock, Signal, Timeframe) at top-right and top-center.
Usage Instructions
Add the indicator to your TradingView chart.
Configure inputs: SMA length, timeframe, KSE100 symbol.
View tables showing signals for 19 PSX stocks.
Use signals to guide trading, combining with other analysis.
Adjust table positions if needed (modify position.top_right/top_center).
Ideal For
PSX traders using SMA and VWAP strategies.
Swing/day traders seeking filtered signals.
Investors tracking KSE100 and stock trends.
Limitations
Limited to 19 stocks due to TradingView’s 40-security-call limit.
Signals rely on SMA, VWAP, and KSE100; combine with other analysis.
Hardcoded stock list; contact the author for customizations.
Notes
Verify stock symbols are valid on your TradingView platform.
Best on 1920x1080+ resolution. Adjust chart scaling if tables overlap.
Published on June 12, 2025, at 11:50 AM PKT.
Disclaimer
Trading carries risk. This indicator is for informational purposes only and not financial advice. Conduct your own research before trading.

Heikinisi Candle (With MA + Smoothing + Buy/Sell with Cooldown)This custom Heikinisi Candle (With MA + Smoothing + Buy/Sell with Cooldown) indicator combines the advantages of Heikin-Ashi candles with the flexibility of multiple moving averages and smoothing options. The built-in buy/sell signals with cooldown functionality help traders avoid overtrading while capturing trend reversals and momentum shifts. Whether you're a day trader, swing trader, or long-term investor, this indicator offers powerful tools for analyzing price action and making informed trading decisions.
Note: Disable the regular candle to get better visualization.
Key Features:
Custom Heikin-Ashi Candles:
The core feature of this script is the Heikin-Ashi candles, which are known for smoothing price action and helping traders identify market trends more clearly.
Unlike traditional Heikin-Ashi, this version adjusts the Heikin-Ashi close based on specific price action patterns, including rejection signals and engulfing patterns.
The custom Heikin-Ashi open also incorporates momentum, adjusting dynamically based on recent price changes.
Price Action Measurements:
The indicator measures key price action components, including:
Body: The absolute difference between the open and close.
Candle Range: The total range from high to low.
Upper Wick: The distance from the highest price to the maximum of open or close.
Lower Wick: The distance from the lowest price to the minimum of open or close.
These measurements help detect bullish and bearish conditions, as well as price rejection signals.
Buy/Sell Signal Logic:
Buy Signal: Triggered when the Heikin-Ashi close is above the chosen moving average (MA1), with a cooldown period to avoid too frequent signals.
Sell Signal: Triggered when the Heikin-Ashi close falls below the MA1 after a buy signal has already been issued.
The cooldown period ensures that buy and sell signals are spaced apart by a specific number of bars, preventing excessive signal generation during periods of price consolidation.
Multiple Moving Averages (MA):
This script supports up to three customizable moving averages (MA1, MA2, MA3), each of which can be set to different types and lengths, including:
Simple Moving Average (SMA)
Exponential Moving Average (EMA)
Weighted Moving Average (WMA)
Volume Weighted Moving Average (VWMA)
Volume Weighted Moving Price (VWMP)
Least Squares Moving Average (LSMA)
Hull Moving Average (HMA)
Double Exponential Moving Average (DEMA)
Triple Exponential Moving Average (TEMA)
Users can adjust the length and type of each MA for tailored analysis.
Smoothing Options for MAs:
Users can smooth the output of MAs using various types of smoothing algorithms (SMA, EMA, LSMA, WMA, Gaussian) and a customizable length. This helps to reduce noise in the moving average lines and provides clearer signals.
Gaussian Filter (Advanced Smoothing):
A Gaussian Filter is available as a smoothing option for MAs. This filter reduces noise and makes the moving averages smoother, which can be particularly helpful in volatile or choppy markets.
Alerts and Visualization:
The script allows users to plot buy and sell signals on the chart with distinctive markers. A Buy Signal is shown below the bar with a lime green marker and text "Buy," while a Sell Signal is shown above the bar with a red marker and text "Sell."
Traders can also set up alerts based on the buy/sell signals to get notified in real time.
Indicator Configuration:
Heikin-Ashi Candle Configuration:
Automatically adjusts Heikin-Ashi candles based on rejection signals, engulfing patterns, and momentum. It uses custom formulas for the Heikin-Ashi open and close, making it more sensitive to price action than standard Heikin-Ashi candles.
Moving Averages (MA) Configuration:
You can select from multiple moving average types and lengths (MA1, MA2, MA3) for trend-following analysis.
Choose between SMA, EMA, WMA, VWMA, VWMP, LSMA, HMA, DEMA, and TEMA.
Smoothing Options:
Enable or disable smoothing for the moving averages.
Select from different smoothing types, including SMA, EMA, RMA, WMA, LSMA, and Gaussian.
Cooldown Period:
Control the number of bars that must pass before a new buy/sell signal is triggered. This cooldown period helps prevent excessive trading signals in quick succession.
How to Use:
Analyze Price Action with Heikin-Ashi Candles:
The custom Heikin-Ashi candles are ideal for spotting market trends, reversals, and price rejection. Use the candle patterns to gauge the market sentiment.
Use MAs for Trend Confirmation:
The moving averages (MA1, MA2, MA3) can help identify the prevailing trend. A price above a rising MA indicates an uptrend, while a price below a falling MA suggests a downtrend.
Trigger Buy and Sell Signals:
When the Heikin-Ashi close crosses above MA1, a buy signal is triggered.
When the Heikin-Ashi close crosses below MA1 after a buy signal, a sell signal is triggered.
The cooldown period ensures that signals are spaced out, preventing overtrading.
Use Smoothing for Clearer Signals:
If you are trading in a volatile market, you can use the smoothing options to make the MAs smoother and reduce noise.

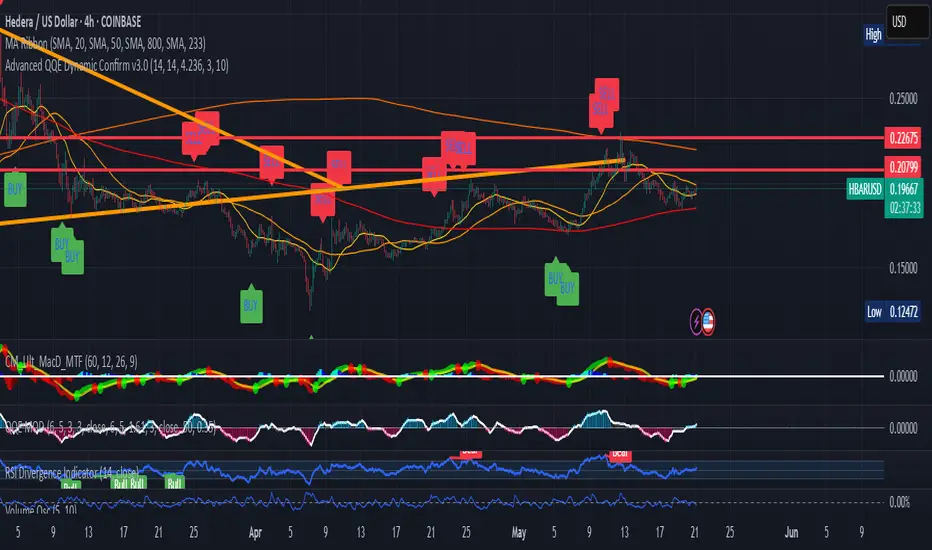
Advanced QQE Buy/Sell with Confirmation FiltersAdvanced QQE Buy/Sell with Confirmation Filters
This indicator provides high-probability Buy and Sell signals using an advanced Quantitative Qualitative Estimation (QQE) method, enhanced by optional powerful confirmation filters.
Core Strategy:
📈 QQE Signals: Based on smoothed RSI crossover of dynamic threshold bands.
🎯 Buy Signal: Triggered when RSI crosses above QQE Lower Band.
🎯 Sell Signal: Triggered when RSI crosses below QQE Upper Band.
Optional Confirmation Filters:
🔧 RSI Filter: Only accept buys when RSI > 55 or sells when RSI < 45.
🔧 MACD Histogram Filter: Confirms momentum direction.
🔧 VWAP Filter: Confirms if price is above (bullish) or below (bearish) VWAP.
Customization Options:
Adjust RSI Length, QQE Smoothing Length, and Threshold to match your trading style.
Independently toggle each confirmation filter ON/OFF from the settings.
VWAP line can also be plotted on chart for visual guidance.
Key Features:
Clean Buy (green up label) and Sell (red down label) signals plotted on chart.
Alerts available for Buy/Sell triggers.
Optimized for fast performance and low lag.
Recommended Timeframes:
15min, 1H, 4H, Daily.
Disclaimer:
This indicator is for educational purposes only. Trading involves risk. Always perform your own due diligence.
Developed and optimized by Keyvan 🚀
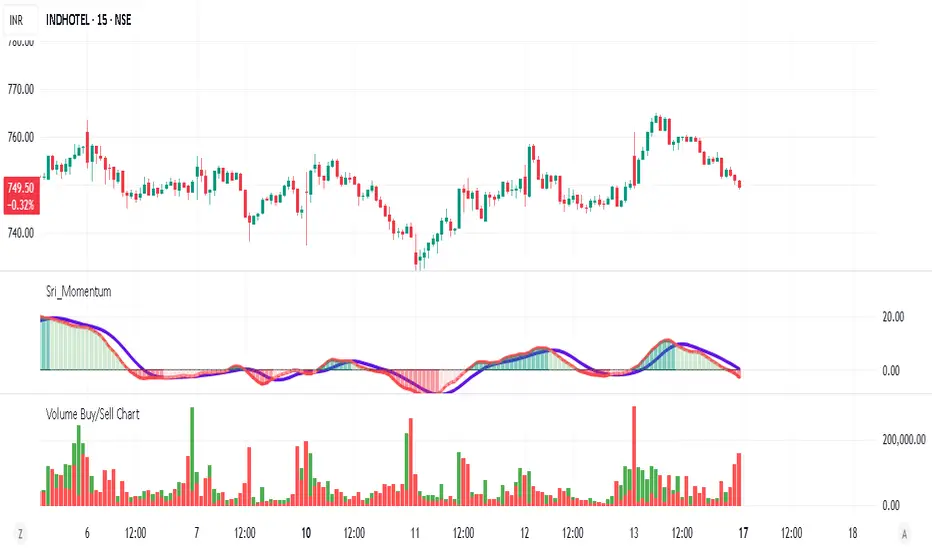
Volume Buy/Sell ChartVolume Buy/Sell Chart
This script visualizes the distribution of buying and selling volume within each candlestick, helping traders identify dominant market pressure at a glance. It separates volume into Buy Volume (Green) and Sell Volume (Red) using a unique calculation based on price movement within a candle.
Features:
✅ Customizable Bar Display: Choose to display 5, 10, or 100 bars using a simple dropdown selection.
✅ Buy & Sell Volume Calculation: The script determines buying and selling volume dynamically based on price action within the candle.
✅ Custom Volume Threshold for Alerts: Set a percentage threshold (0–100) to trigger alerts when buy or sell volume exceeds a predefined level.
✅ Color-Coded Histogram:
Green Bars: Represent the estimated buy volume.
Red Bars: Represent the estimated sell volume.
✅ Alerts Integration: Automatically detect strong buy or sell signals when the respective volume percentage exceeds your set threshold.
How It Works:
The script calculates total price movement within a candle.
It then estimates buying and selling volume ratios based on whether the price closes higher or lower than it opened.
Finally, it normalizes the buy/sell volume against the total volume and plots it as a column chart.
Usage Guide:
Add the script to your chart.
Select how many bars to display (5, 10, or 100).
Adjust the Custom Volume Percentage Threshold (default: 75%).
Watch for significant buy/sell volume imbalances that might indicate market turning points!
This tool is great for traders looking to analyze volume flow and market sentiment with a simple yet effective visualization. 🚀
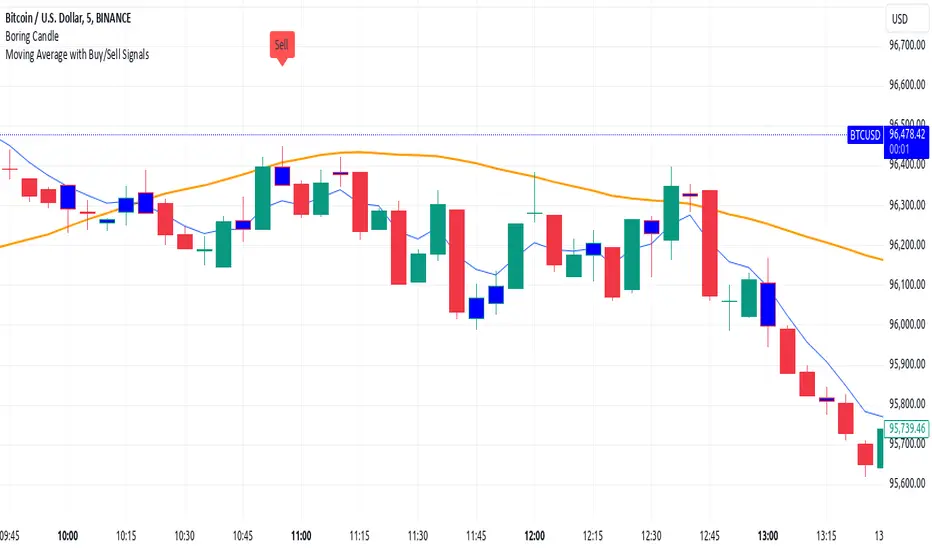
Moving Average with Buy/Sell SignalsBINANCE:BTCUSD
Pine Script Brief: "44 Moving Average with Buy/Sell Signals"
This Pine Script is designed to generate buy and sell signals based on the interaction of the price with the 44-period Simple Moving Average (SMA). It also considers the closing behavior of the last five candles to further refine the conditions for generating signals. The script is intended for use in technical analysis for trading strategies on platforms like TradingView.
Features:
44-Period Simple Moving Average (SMA):
The script calculates and plots the 44-period SMA of the closing price on the chart, providing a trend-following indicator.
The SMA is used as a key level to determine when price action is "touching" or interacting with the moving average.
Buy and Sell Signal Logic:
Buy Signal:
The candle is green (close > open).
The candle's high and low are around the 44 SMA, indicating the candle is "touching" or near the moving average.
At least 2 of the last 5 candles must have closed above the 44 SMA.
The 44 SMA is positioned below the midpoint of the current candle.
Sell Signal:
The candle is red (close < open).
The candle's high and low are around the 44 SMA.
At least 2 of the last 5 candles must have closed below the 44 SMA.
The 44 SMA is positioned above the midpoint of the current candle.
Label Plotting:
The script uses the plotSignal function to plot buy and sell labels directly on the chart. The labels are plotted at the low of a green candle (for buy signals) and the high of a red candle (for sell signals).
Labels are color-coded for quick identification: green for buy and red for sell.
EMA for Smoothing (Optional):
An optional Exponential Moving Average (EMA) is plotted for additional trend smoothing, allowing users to visualize another moving average for possible trend-following strategies.
The length of the EMA is customizable, and it is plotted on the chart alongside the 44 SMA.
Alert Conditions:
Alerts can be set up for both buy and sell signals, notifying the user when these conditions are met. The alerts are triggered whenever the script detects a valid buy or sell signal.
Customizable Inputs:
The script allows customization of the following:
Smoothing Length: For the optional EMA line.
Tolerance: For adjusting the proximity check (candle touching the 44 SMA).
Styling: The color and text of the buy and sell labels can be customized.
Usage:
This script can be used by traders who want to identify possible entry and exit points based on price interaction with the 44-period moving average, combined with the behavior of previous candles. It is suitable for trend-following strategies and can be used in conjunction with other indicators to refine trading decisions.
Key Benefits:
Provides visual signals (buy/sell) directly on the chart.
Considers both immediate price action and historical trends (previous candles).
Offers customization for moving averages and labels.
Alerts can be set for automated notifications.
This Pine Script helps traders make informed decisions by combining the reliability of moving averages with price action and historical candle behavior, enhancing trading strategies based on trend-following principles.
Multifactor Buy/Sell Strategy V2 | RSI, MACD, ATR, EMA, Boll.BITGET:1INCHUSDT
This Pine Script code for TradingView is a multifactor Buy/Sell indicator that combines several technical factors to generate trading signals based on trend, volatility, and volume conditions. Here’s a breakdown of the main components and functionality:
Indicator Name
- Multifactor Buy/Sell Strategy V2 — an overlay indicator applied directly on the price chart.
### Input Parameters
The script includes multiple customizable parameters:
- RSI, EMA, MACD parameters — for setting periods and signals of MACD and RSI.
- ATR and Bollinger Bands — used for volatility analysis and level determination.
- Minimum Volatility Threshold — sets a minimum Bollinger Band width threshold for determining high volatility.
Core Indicators
1. RSI — calculated to identify oversold (below 30) and overbought (above 70) conditions.
2. EMA and MACD — calculates exponential moving averages and MACD histogram to determine trend direction.
3. ATR and Bollinger Bands — used to assess current volatility and establish dynamic upper and lower bands.
Volatility and Volume Analysis
- Determines the current ATR level and Bollinger Band width to evaluate high volatility.
- Calculates the volume moving average to track periods of increased volume during high volatility.
Trend Analysis
The script uses the difference between fast and slow EMAs to define strong trends:
- Uptrend — when the fast EMA is above the slow EMA, the price is above the fast EMA, and the trend is strong.
- Downtrend — when the fast EMA is below the slow EMA, the price is below the fast EMA, and the trend is strong.
Momentum Filter
- Based on the price change over the last three bars and compared against the minimum volatility threshold to identify strong momentum.
Buy and Sell Signal Generation
- Buy Signal: Uptrend with RSI oversold, positive MACD histogram, high volatility and volume, strong momentum, and sufficient Bollinger Band width.
- Sell Signal: Downtrend with RSI overbought, negative MACD histogram, high volatility and volume, strong momentum, and sufficient Bollinger Band width.
Visualization
- Buy and sell signals are displayed as green and red triangles on the chart.
- Plots for fast and slow EMAs, upper and lower bands, and Bollinger Bands.
Alerts
The script includes alert conditions for buy and sell signals, allowing notifications to be sent via email or mobile app.
Information Panel
A small table on the chart displays current volatility dataThis Pine Script code for TradingView is a multifactor Buy/Sell indicator that combines several technical factors to generate trading signals based on trend, volatility, and volume conditions. Here’s a breakdown of the main components and functionality:
Indicator Name
- Multifactor Buy/Sell Strategy V2 — an overlay indicator applied directly on the price chart.
Input Parameters
The script includes multiple customizable parameters:
- **RSI, EMA, MACD parameters** — for setting periods and signals of MACD and RSI.
- **ATR and Bollinger Bands** — used for volatility analysis and level determination.
- **Minimum Volatility Threshold** — sets a minimum Bollinger Band width threshold for determining high volatility.
Core Indicators
1. RSI — calculated to identify oversold (below 30) and overbought (above 70) conditions.
2. EMA and MACD — calculates exponential moving averages and MACD histogram to determine trend direction.
3. ATR and Bollinger Bands — used to assess current volatility and establish dynamic upper and lower bands.
Volatility and Volume Analysis
- Determines the current ATR level and Bollinger Band width to evaluate high volatility.
- Calculates the volume moving average to track periods of increased volume during high volatility.
Trend Analysis
The script uses the difference between fast and slow EMAs to define strong trends:
- Uptrend — when the fast EMA is above the slow EMA, the price is above the fast EMA, and the trend is strong.
- Downtrend — when the fast EMA is below the slow EMA, the price is below the fast EMA, and the trend is strong.
Momentum Filter
- Based on the price change over the last three bars and compared against the minimum volatility threshold to identify strong momentum.
Buy and Sell Signal Generation
- Buy Signal: Uptrend with RSI oversold, positive MACD histogram, high volatility and volume, strong momentum, and sufficient Bollinger Band width.
- Sell Signal: Downtrend with RSI overbought, negative MACD histogram, high volatility and volume, strong momentum, and sufficient Bollinger Band width.
Visualization
- Buy and sell signals are displayed as green and red triangles on the chart.
- Plots for fast and slow EMAs, upper and lower bands, and Bollinger Bands.
Alerts
The script includes alert conditions for buy and sell signals, allowing notifications to be sent via email or mobile app.
Information Panel
A small table on the chart displays current volatility
- Volatility Status — indicates high or low volatility.
- Bollinger Band Width — current width as a percentage.
- ATR Ratio — ratio of current ATR to long-term average ATR.
This script is suitable for trading in high-volatility conditions, combining multiple filters and factors to generate precise buy and sell signals.

Simplest Strategy Crossover with Labels Buy/Sell to $1000This Pine Script code, titled Custom Moving Average Crossover with Labels, is a trading indicator developed for the TradingView platform. It enables traders to visualize potential buy and sell signals based on the crossover of two moving averages, offering customizable settings for enhanced flexibility. Here’s a breakdown of its key features:
Key Features
User-Defined Moving Averages:
The script includes two moving averages: a fast and a slow one. Users can adjust the periods of each average (default values are 10 for the fast MA and 100 for the slow MA), allowing them to adapt the indicator to various market conditions and trading styles.
Time-Restricted Signal Validity:
The indicator includes settings for active trading hours, defined in UTC time. Users specify a start and end hour, making it possible to limit buy and sell signals to certain times of the day. This is especially useful for traders who wish to avoid signals outside their preferred trading hours or during periods of high volatility.
Crossover-Based Buy and Sell Signals:
Buy Signal: A "Buy" label is triggered and displayed when the fast moving average crosses above the slow moving average within the user-defined trading hours, signifying a potential upward trend.
Sell Signal: A "Sell" label is generated when the fast moving average crosses below the slow moving average, indicating a possible downtrend. Labels are displayed on the chart, color-coded for easy identification: green for buys and red for sells.
Profit Target Labels (+100 Points):
After each buy or sell entry, the indicator tracks price movements. When the price increases by 100 points from a buy entry or decreases by 100 points from a sell entry, a +100 label appears to signify a 100-point movement.
These labels serve as checkpoints to help traders assess performance and decide on further actions, such as taking profits or adjusting stop losses.
Visual Customization:
The moving averages are color-coded (blue for fast MA, red for slow MA) for easy distinction, and label text appears in white to enhance visibility against various chart backgrounds.
Benefits for Traders
Efficient Trade Identification: The moving average crossover combined with time-based restrictions allows traders to capture key market trends within chosen hours.
Clear Profit Checkpoints: The +100 point label alerts traders to significant price movement, useful for those looking for set profit targets.
Flexibility: Customizable inputs give users control over the indicator’s behavior, making it suitable for both day trading and swing trading.
This indicator is designed for traders looking to enhance their technical analysis with reliable, user-defined buy/sell signals, helping to increase confidence and improve trade timing based on objective data.

Stoch RSI and RSI Buy/Sell Signals with MACD Trend FilterDescription of the Indicator
This Pine Script is designed to provide traders with buy and sell signals based on the combination of Stochastic RSI, RSI, and MACD indicators, enhanced by the confirmation of candle colors. The primary goal is to facilitate informed trading decisions in various market conditions by utilizing different indicators and their interactions. The script allows customization of various parameters, providing flexibility for traders to adapt it to their specific trading styles.
Usefulness
This indicator is not just a mashup of existing indicators; it integrates the functionality of multiple momentum and trend-detection methods into a cohesive trading tool. The combination of Stochastic RSI, RSI, and MACD offers a well-rounded approach to analyzing market conditions, allowing traders to identify entry and exit points effectively. The inclusion of color-coded signals (strong vs. weak) further enhances its utility by providing visual cues about the strength of the signals.
How to Use This Indicator
Input Settings: Adjust the parameters for the Stochastic RSI, RSI, and MACD to fit your trading style. Set the overbought/oversold levels according to your risk tolerance.
Signal Colors:
Strong Buy Signal: Indicated by a green label and confirmed by a green candle (close > open).
Weak Buy Signal: Indicated by a blue label and confirmed by a green candle (close > open).
Strong Sell Signal: Indicated by a red label and confirmed by a red candle (close < open).
Weak Sell Signal: Indicated by an orange label and confirmed by a red candle (close < open).
Example Trading Strategy Using This Indicator
To effectively use this indicator as part of your trading strategy, follow these detailed steps:
Setup:
Timeframe : Select a timeframe that aligns with your trading style (e.g., 15-minute for intraday, 1-hour for swing trading, or daily for longer-term positions).
Indicator Settings : Customize the Stochastic RSI, RSI, and MACD parameters to suit your trading approach. Adjust overbought/oversold levels to match your risk tolerance.
Strategy:
1. Strong Buy Entry Criteria :
Wait for a strong buy signal (green label) when the RSI is at or below the oversold level (e.g., ≤ 35), indicating a deeply oversold market. Confirm that the MACD shows a decreasing trend (bearish momentum weakening) to validate a potential reversal. Ensure the current candle is green (close > open) if candle color confirmation is enabled.
Example Use : On a 1-hour chart, if the RSI drops below 35, MACD shows three consecutive bars of decreasing negative momentum, and a green candle forms, enter a buy position. This setup signals a robust entry with strong momentum backing it.
2. Weak Buy Entry Criteria :
Monitor for weak buy signals (blue label) when RSI is above the oversold level but still below the neutral (e.g., between 36 and 50). This indicates a market recovering from an oversold state but not fully reversing yet. These signals can be used for early entries with additional confirmations, such as support levels or higher timeframe trends.
Example Use : On the same 1-hour chart, if RSI is at 45, the MACD shows momentum stabilizing (not necessarily negative), and a green candle appears, consider a partial or cautious entry. Use this as an early warning for a potential bullish move, especially when higher timeframe indicators align.
3. Strong Sell Entry Criteria :
Look for a strong sell signal (red label) when RSI is at or above the overbought level (e.g., ≥ 65), signaling a strong overbought condition. The MACD should show three consecutive bars of increasing positive momentum to indicate that the bullish trend is weakening. Ensure the current candle is red (close < open) if candle color confirmation is enabled.
Example Use : If RSI reaches 70, MACD shows increasing momentum that starts to level off, and a red candle forms on a 1-hour chart, initiate a short position with a stop loss set above recent resistance. This is a high-confidence signal for potential price reversal or pullback.
4. Weak Sell Entry Criteria :
Use weak sell signals (orange label) when RSI is between the neutral and overbought levels (e.g., between 50 and 64). These can indicate potential short opportunities that might not yet be fully mature but are worth monitoring. Look for other confirmations like resistance levels or trendline touches to strengthen the signal.
Example Use : If RSI reads 60 on a 1-hour chart, and the MACD shows slight positive momentum with signs of slowing down, place a cautious sell position or scale out of existing long positions. This setup allows you to prepare for a possible downtrend.
Trade Management:
Stop Loss : For buy trades, place stop losses below recent swing lows. For sell trades, set stops above recent swing highs to manage risk effectively.
Take Profit : Target nearby resistance or support levels, apply risk-to-reward ratios (e.g., 1:2), or use trailing stops to lock in profits as price moves in your favor.
Confirmation : Align these signals with broader trends on higher timeframes. For example, if you receive a weak buy signal on a 15-minute chart, check the 1-hour or daily chart to ensure the overall trend is not bearish.
Real-World Example: Imagine trading on a 15-minute chart :
For a buy:
A strong buy signal (green) appears when the RSI dips to 32, MACD shows declining bearish momentum, and a green candle forms. Enter a buy position with a stop loss below the most recent support level.
Alternatively, a weak buy signal (blue) appears when RSI is at 47. Use this as a signal to start monitoring the market closely or enter a smaller position if other indicators (like support and volume analysis) align.
For a sell:
A strong sell signal (red) with RSI at 72 and a red candle signals to short with conviction. Place your stop loss just above the last peak.
A weak sell signal (orange) with RSI at 62 might prompt caution but can still be acted on if confirmed by declining volume or touching a resistance level.
These strategies show how to blend both strong and weak signals into your trading for more nuanced decision-making.
Technical Analysis of the Code
1. Stochastic RSI Calculation:
The script calculates the Stochastic RSI (stochRsiK) using the RSI as input and smooths it with a moving average (stochRsiD).
Code Explanation : ta.stoch(rsi, rsi, rsi, stochLength) computes the Stochastic RSI, and ta.sma(stochRsiK, stochSmoothing) applies smoothing.
2. RSI Calculation :
The RSI is computed over a user-defined period and checks for overbought or oversold conditions.
Code Explanation : rsi = ta.rsi(close, rsiLength) calculates RSI values.
3. MACD Trend Filter :
MACD is calculated with fast, slow, and signal lengths, identifying trends via three consecutive bars moving in the same direction.
Code Explanation : = ta.macd(close, macdLengthFast, macdLengthSlow, macdSignalLength) sets MACD values. Conditions like macdLine < macdLine confirm trends.
4. Buy and Sell Conditions :
The script checks Stochastic RSI, RSI, and MACD values to set buy/sell flags. Candle color filters further confirm valid entries.
Code Explanation : buyConditionMet and sellConditionMet logically check all conditions and toggles (enableStochCondition, enableRSICondition, etc.).
5. Signal Flags and Confirmation :
Flags track when conditions are met and ensure signals only appear on appropriate candle colors.
Code Explanation : Conditional blocks (if statements) update buyFlag and sellFlag.
6. Labels and Alerts :
The indicator plots "BUY" or "SELL" labels with the RSI value when signals trigger and sets alerts through alertcondition().
Code Explanation : label.new() displays the signal, color-coded for strength based on RSI.
NOTE : All strategies can be enabled or disabled in the settings, allowing traders to customize the indicator to their preferences and trading styles.
